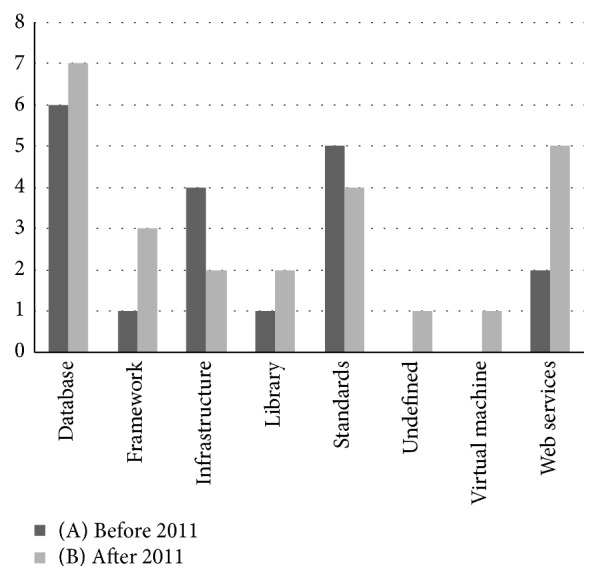
Figure 3.

Technology outcomes' evaluation evolution breakdown chart. This chart features the key technological outcomes across the various projects, as assessed according to the proposed evaluation framework. To better understand the results' evolution over time, project evaluation results are divided between projects started before the year 2011 (A) and after the year 2011 (B).
