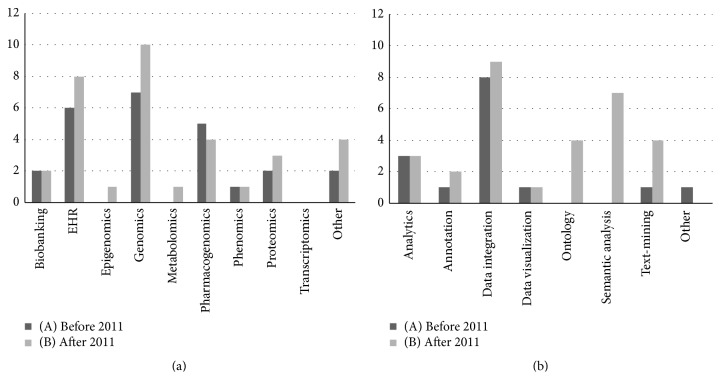
Figure 4.
Science outcomes' evaluation evolution breakdown charts. Charts summarizing the various scientific research topics covered across the various projects assessed with the proposed evaluation framework. (a) Field of research; (b) area of interest. To better understand the results' evolution over time, project evaluation results are divided between projects started before the year 2011 (A) and after the year 2011 (B).

