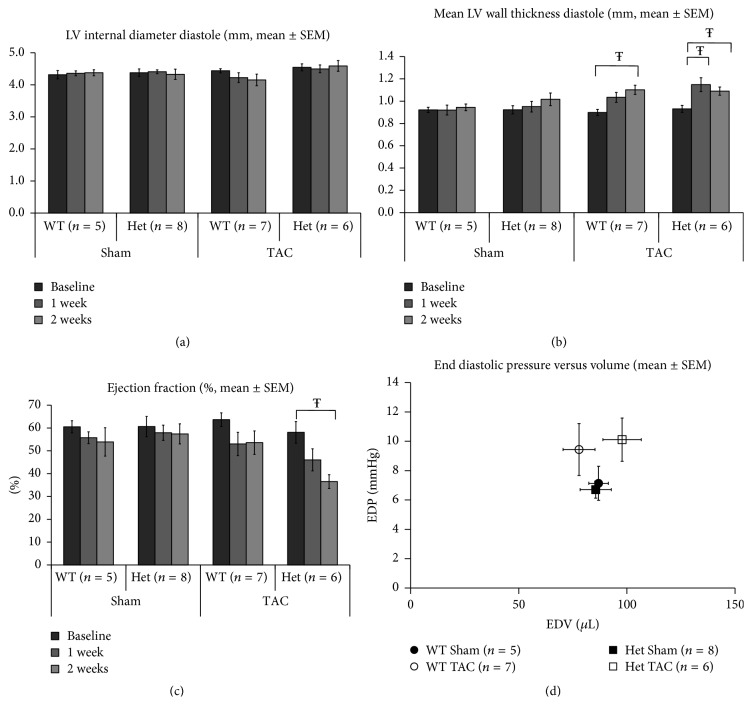
Figure 2.
Echocardiographic and LV pressure assessments of WT and Het mice at baseline, week 1, and week 2 following TAC. (a) There is no evidence of LV dilatation in either genotype in either the presence or absence of TAC. (b) The onset of ventricular hypertrophy appears to be more rapid in the Het group demonstrating significant increases by week 1 unlike WT mice which only manifest significant thickening by week 2. (c) The reduction in EF% induced by TAC in the Het group is significant by week 2, unlike the WT TAC mice which tended to demonstrate a fall in this measure of contractile function but did not reach significance at either time point after TAC surgery. (d) Differences in EDP between groups do not reach significance although the trend is towards increase in both TAC groups. Interestingly the EDV trend although also not significant for the Het TAC group moves to the right of the Sham Het group, a change reflective of ventricular dilatation, whereas the EDV of the WT TAC mice changes little and even moves to the left more aligned to a physiological adaptation (Ŧ p < 0.05). Sample sizes are also shown.

