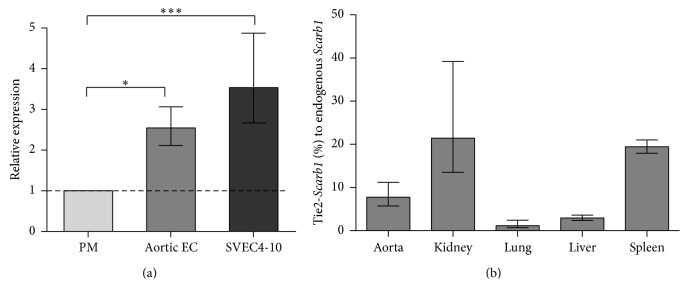
Figure 1.

RT-PCR analysis of Scarb1 gene expression. (a) Expression of endogenous Scarb1 in cultures of normal mouse aortic EC and SVEC4-10 cells relative to expression of the same gene in peritoneal macrophages. ∗ P < 0.04; ∗∗∗ P < 0.0001. (b) Expression of Scarb1 transgene in tissues of Tie2-Scarb1 × Scarb1-KO females is shown as the percentage of the level of expression of endogenous Scarb1 in the same tissues of normal C57Bl/6N females. N = 3 in each case. Results are presented as the mean ± 1 SEM.
