
Figure 10.
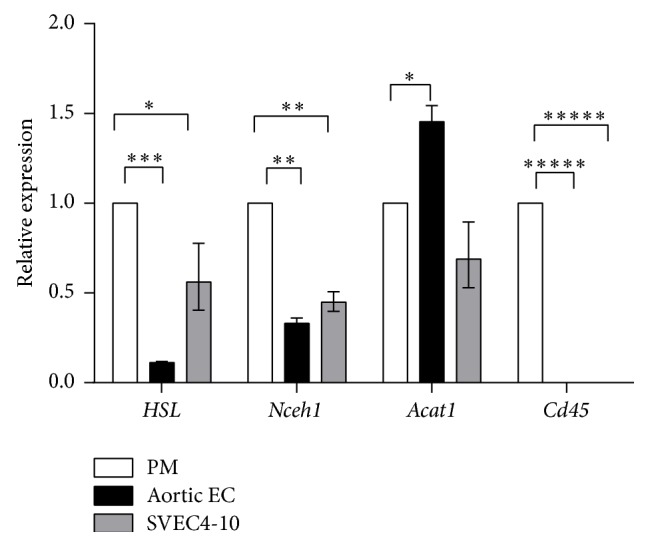
RT-PCR analysis of Hsl, Nceh1, Acat1, and Cd45 gene expression in normal mouse aortic EC and SVEC4-10 relative to expression of the same genes in peritoneal macrophages (PM). Results are presented as the mean ± 1 SEM. ∗ P < 0.05; ∗∗ P < 0.001; ∗∗∗ P < 0.0001; ∗∗∗∗∗ P < 0.000001.