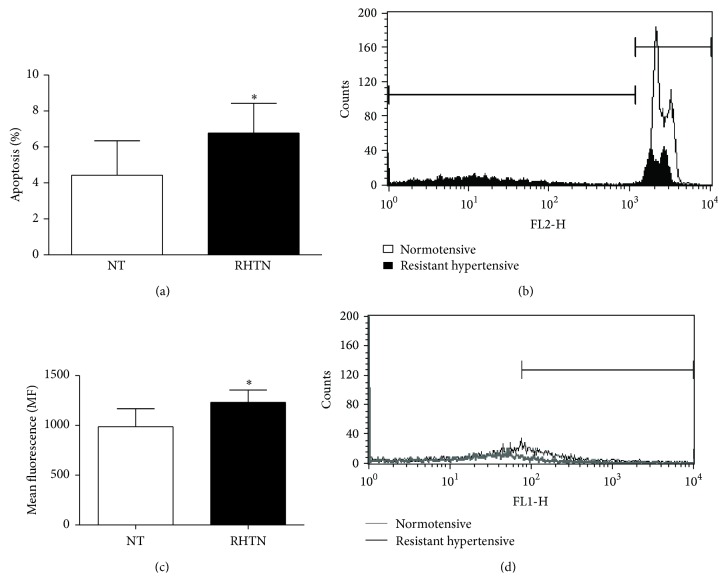
Figure 2.
Percentage of apoptosis (a) and representative histograms overlay depicting fluorescence at FL2 (b) of HUVECs incubated with DNA fragmentation buffer and previously treated with serum from normotensive individuals (NT, n = 8) or resistant hypertensive patients (RHTN, n = 8). Mean ROS content (c) and representative histograms overlay depicting fluorescence at FL1 (d) from HUVECs incubated with DHCF and previously treated with serum from NT (n = 8) or RHTN (n = 8) (∗ p < 0.05 versus NT). Mean ± SD. The experiments were performed in duplicate.

