Figure 3.
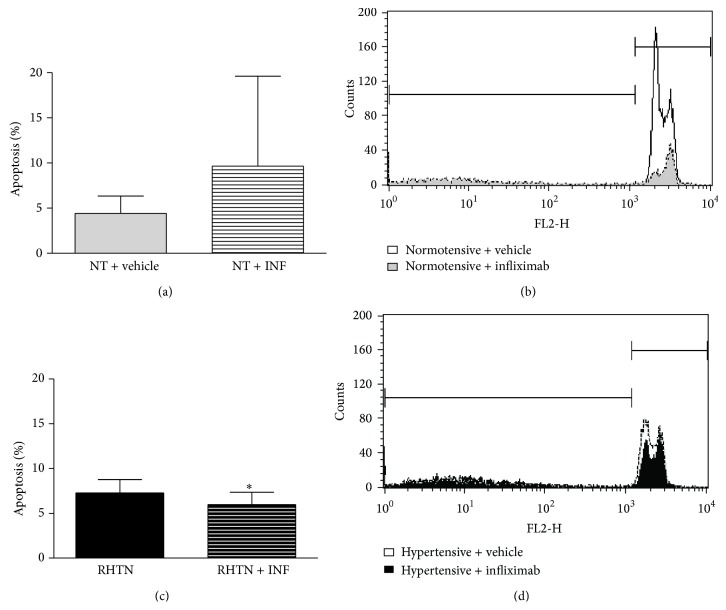
Percentage of apoptotic cells (cells with fragmented DNA) (a) and representative histograms overlay depicting fluorescence at FL2 (b) of HUVECs incubated with DNA fragmentation buffer and previously treated with serum from normotensive individuals (NT, n = 8) added with vehicle or infliximab. Percentage of apoptotic cells (cells with fragmented DNA) (c) and representative histograms overlay depicting fluorescence at FL2 (d) of HUVECs incubated with DNA fragmentation buffer and previously treated with serum from hypertensive patients (RHTN, n = 8) added with vehicle or infliximab (∗ p < 0.05 versus vehicle). Mean ± SD. The experiments were performed in duplicate.

