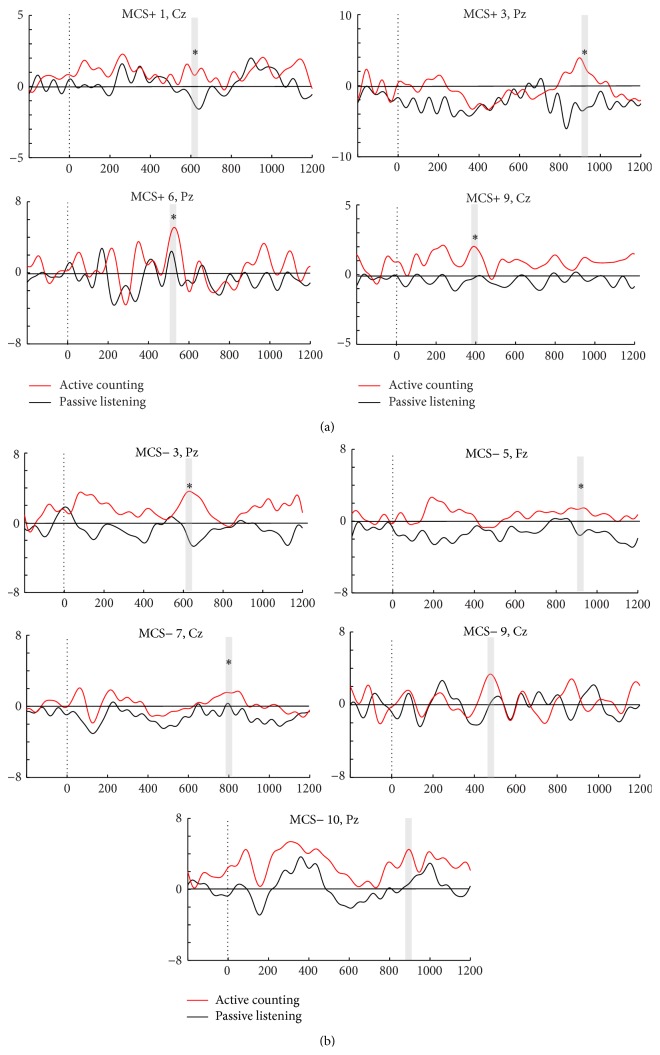
Figure 5.
Individual patients considered responders in the active counting condition of task 2. (a) Illustrates ERPs in individual MCS+ responders in task 2, while (b) provides ERPs in individual MCS− responders. The averaged ERPs in the active counting (red) versus passive (black) condition (y-axis, amplitude in μV; x-axis, time in ms) are illustrated. Observed significant differences of P3 amplitude between conditions (p values < .05 to .001) are marked with a star above the P3 curve marked with grey line.

