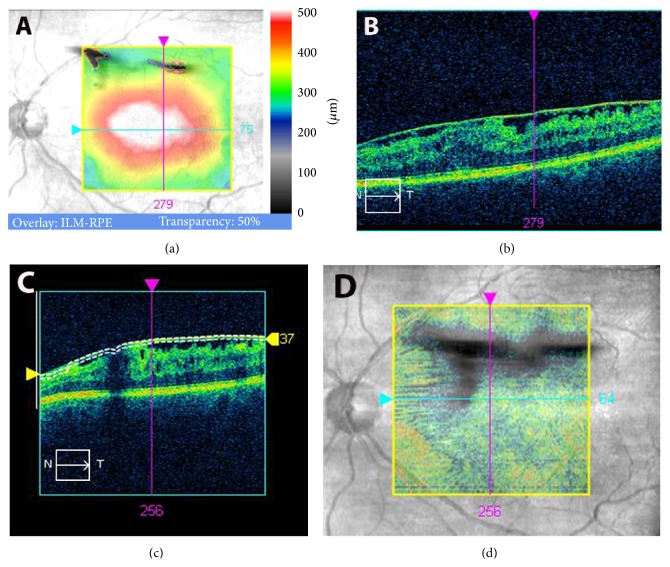
Figure 2.
Large area of elevated epiretinal membrane (EM). (a) Macular thickness map obtained with spectral domain-optical coherence tomography (SD-OCT). (b) Line scanning ophthalmoscope (LSO) SD-OCT image. (c) Selection of the slab layer of the internal limiting membrane (ILM). (d) ILM overlay selection over LSO image in transparency reveals elevated part of EM. Large darker areas of elevated EM indicate potential points for safer initial grasping of the membrane.

