Figure 4.

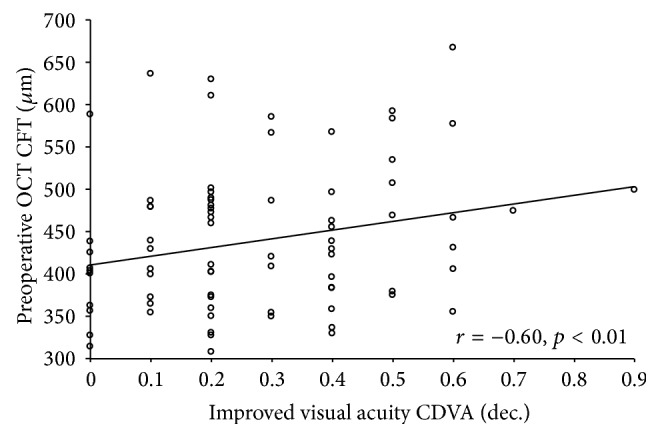
Scattergram showing the relationship between the change in corrected distance visual acuity (CDVA) and preoperative central foveal thickness (CFT). The line of best fit obtained by the least-squares fitting method is shown.

Scattergram showing the relationship between the change in corrected distance visual acuity (CDVA) and preoperative central foveal thickness (CFT). The line of best fit obtained by the least-squares fitting method is shown.