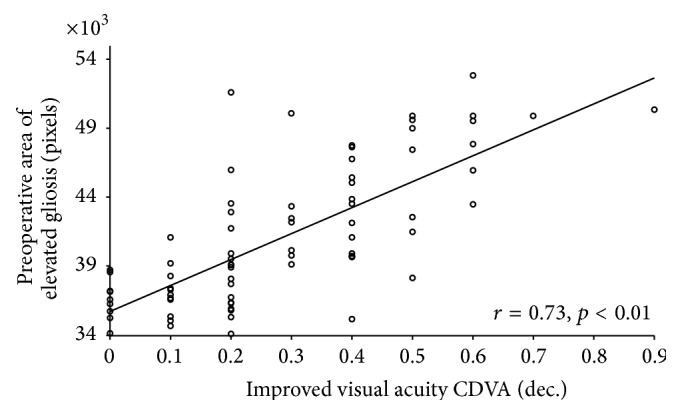
Figure 5.

Scattergram showing the relationship between the change in corrected distance visual acuity (CDVA) and preoperative epiretinal membrane (EM) area (pixels) with no retinal contact (elevated EM). The line of best fit obtained by the least-squares fitting method is shown.
