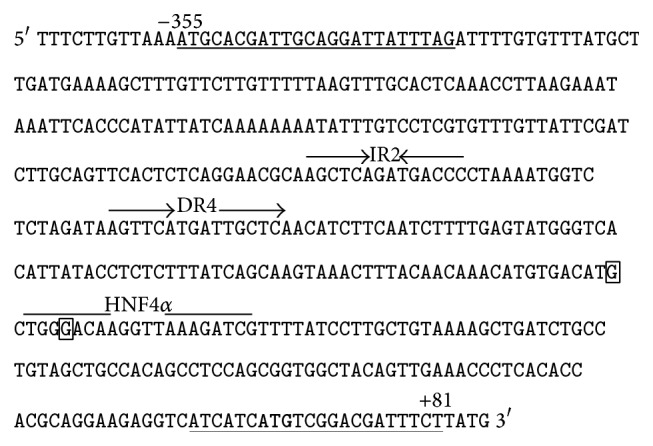
Figure 1.

The DNA sequence within SULT2A1 promoter region (−367 to +85). The positions of the studied SNPs, that is, rs11569683, rs112433193, are marked in squares. The PXR binding sites are represented by IR2 and DR4 motif. The HNF4 alpha binding site is marked. The location of primers used in the sequencing of HNF4alpha and PXR binding sites is underlined.
