Figure 3.

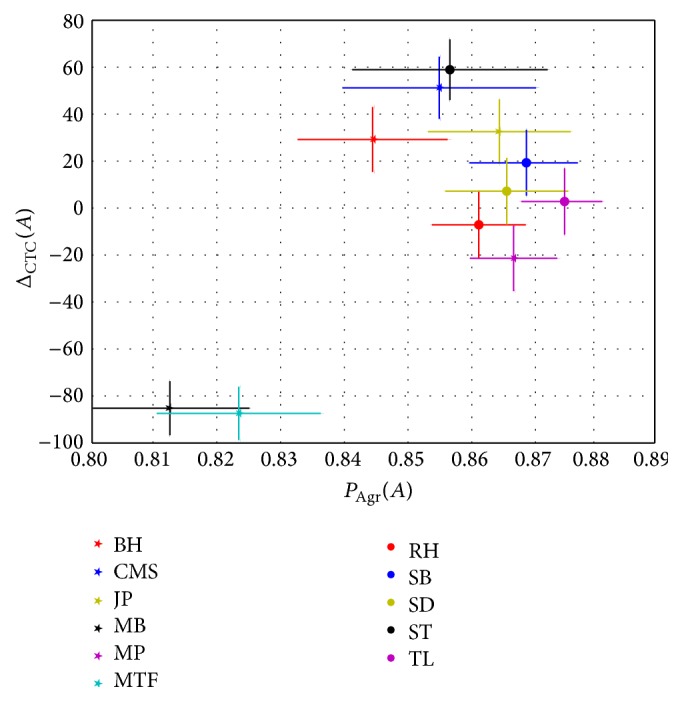
The average agreement for the observers plotted against the difference in number of found CTCs between the observers. Bars indicate the standard errors around the means.

The average agreement for the observers plotted against the difference in number of found CTCs between the observers. Bars indicate the standard errors around the means.