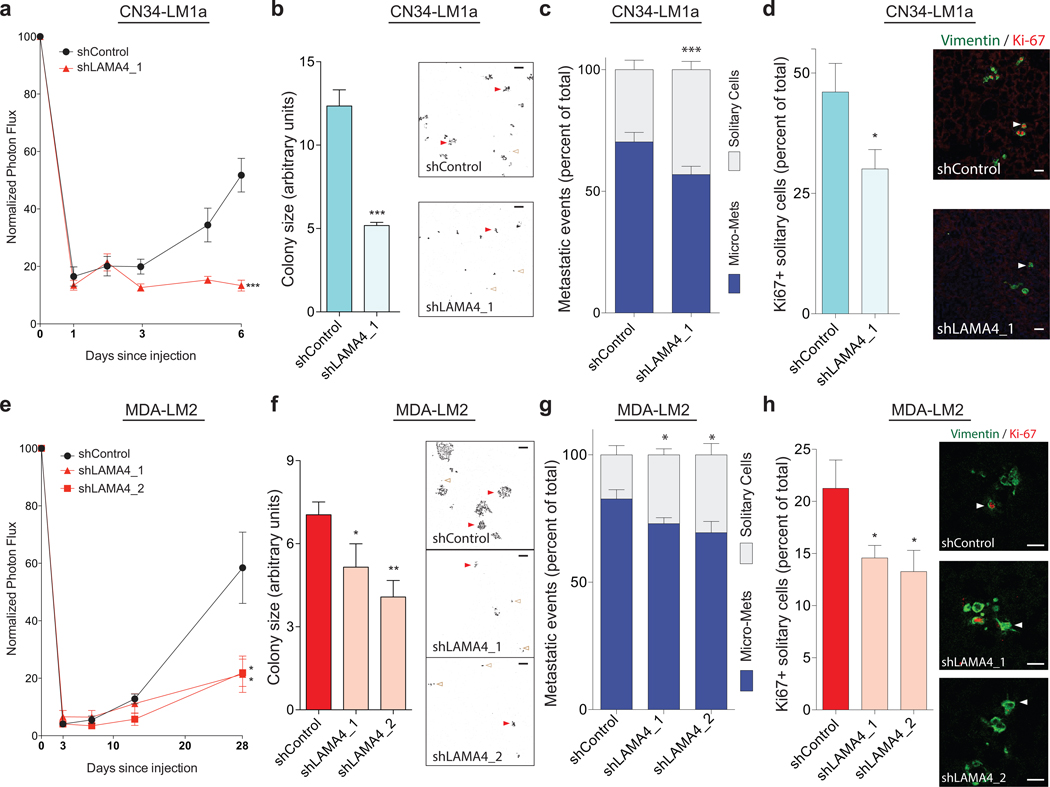
Figure 6. LAMA4 promotes the proliferation of disseminated metastatic cells and micro-metastasis formation in vivo.
(a–d) 3×10⁵ CN34-LM1a cells transduced with either control shRNA or an shRNA targeting LAMA4 were injected intravenously into immunodeficient mice and lung bioluminescence was measured over time (a). n = 5 independent mice. On day 6, lungs were harvested, sectioned, and stained with vimentin and Ki-67. Upon fluorescence image acquisition using confocal microscopy and software analysis, the average size of metastatic colonies was quantified (b; representative background-subtracted vimentin stained images, right. Scale bars: 100μm), the number of solitary single cells relative to multi-cellular colonies (micro-metastases) was quantified (c; see panel b for representative images. Red closed arrows, micro-metastases. Brown open arrows, solitary cells), and the percentage of solitary single cells that stained positively for Ki67 was quantified (d; vimentin staining in green. Ki67 staining in red. Arrows depict solitary cells. Scale bars: 25μm). n = 5 lungs from 5 independent mice. Micro-mets is micro-metastases. (e–h) 3×10⁵ MDA-LM2 cells transduced with either control shRNA or two independent shRNAs targeting LAMA4 were injected intravenously into immunodeficient mice and lung bioluminescence was measured over time (e). n = 6 (shControl), n = 4 (shLAMA4_1), n = 4 (shLAMA4_2) independent mice. On day 28 lungs were harvested, sectioned, and stained with vimentin and Ki-67. Upon fluorescence image acquisition using confocal microscopy and software analysis, the average size of metastatic colonies was quantified (f; representative background-subtracted vimentin stained images, right. Scale bars: 100μm), the number of solitary single cells relative to multi-cellular colonies (micro-metastases) was quantified (g; see panel f for representative images. Red closed arrows, micro-metastases. Brown open arrows, solitary cells), and the percentage of solitary single cells that stained positively for Ki67 was quantified (h; vimentin staining in green. Ki67 staining in red. Arrows depict solitary cells. Scale bars: 25μm). n = 4 lungs from 4 independent mice. Micro-mets is micro-metastases. *P<0.05, **P<0.01, ***P<0.001 were obtained using a one-sided Student’s t-test (a–h). All data are represented as mean +/± S.E.M.

