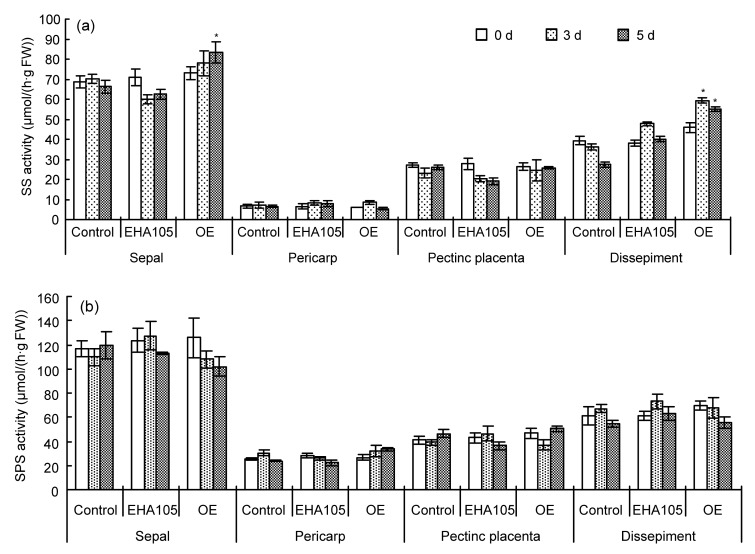
Fig. 3.
Activities of sucrose synthase (SS) and sucrose phosphate synthase (SPS) in the sepal, pericarp, pectinic placenta, and dissepiment of Micro-Tom tomato fruits without agroinjection treatment (control), agroinjected with EHA105, or agroinjected with EHA105 containing p1300-2A11-INH plasmid (OE) at 0, 3, and 5 d, respectively
(a) SS activity; (b) SPS activity. Data are expressed as mean±SE (n=3). * P<0.05, compared with the control

