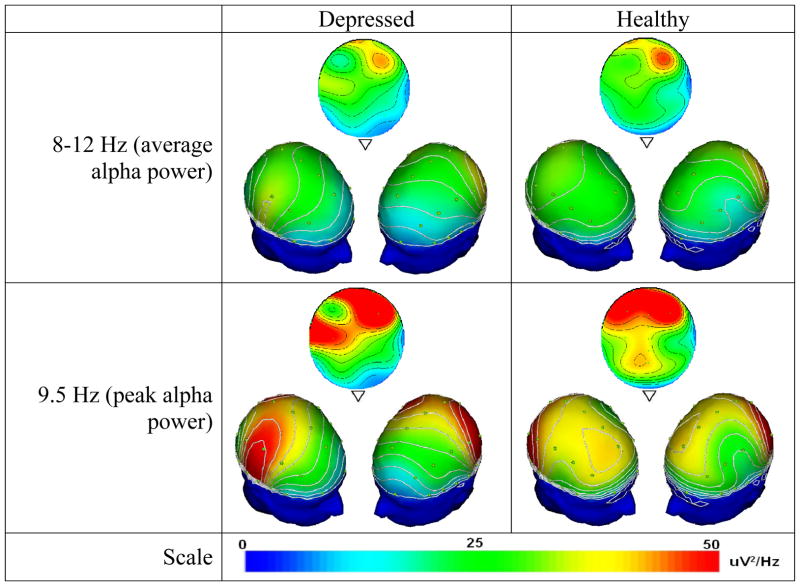
Figure 1.
Topographical distributions of 8–12 Hz band average alpha power (top) and 9.5 Hz peak alpha power (bottom) for depressed (left) and healthy (right) participants, showing a top view stretched across all recording sites, along with two 3D-rotated views to display frontal laterality. Depressed participants assessed at pretreatment show a more diffuse anterior-to-posterior pattern of alpha activation (note contour lines) unlike healthy participants who retain focused right frontal activity. Both groups have a peak frequency at 9.5 Hz, at which the noted contrast is particularly evident. Contour lines are spaced at intervals of 5 μV2/Hz.

