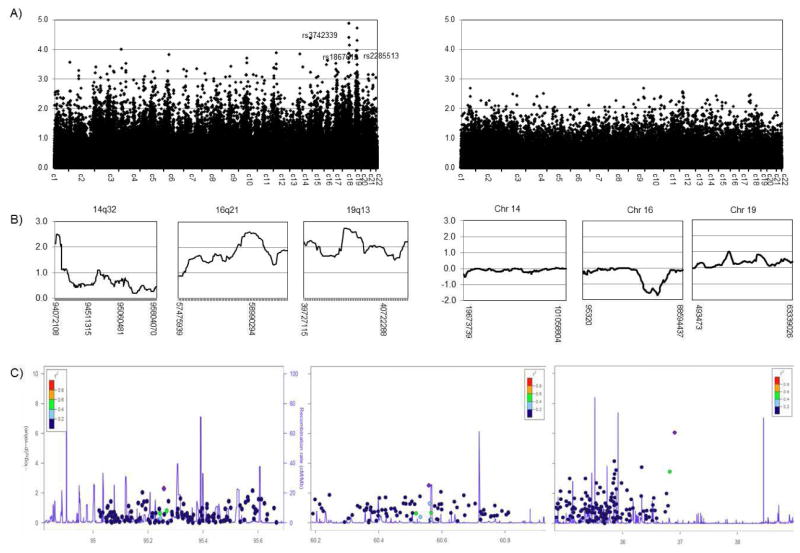
Figure 1.
Results of the genome-wide linkage and association analyses. A) Genome-wide non-parametric two-point linkage analysis in LOAD+P (right panel) and LOAD-P families (left panel); X-axis represent each of the analyzed chromosomes and Y–axis correspond to the individual SNP’s LOD score B) Multi-point linkage analysis in chromosomal regions with genome-wide significant (two-point LOD scores evidence of linkage ≥ 3.6) in the LOAD+P families (right panel) and multi-point linkage analysis of the same chromosomes in the LOAD-P families. X-axis represent physical location in bp and Y-axis represent the individual SNP’s LOD score; C) Joint linkage and association analysis in 50kb region encompassing the linkage peak for chromosomal regions multi-point LOD scores ≥ 2.5 in the LOAD+P families. The X-axis represent represents base-pair position (Mb) along the chromosome, the left Y-axis correspond to the recombination rate (cM/Mb) and the right Y-axis correspond to the logarithm of the p-value.

