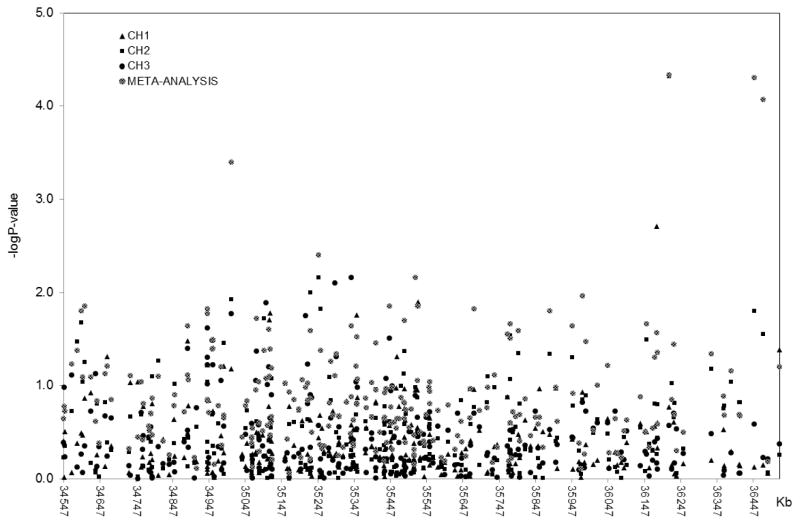
Figure 2. Generalization of 19q13.12 region in Caribbean Hispanics (CH) cohorts.
Multivariate regression results from three independent Caribbean Hispanics replication cohorts and their meta-analysis. X-axis represents physical location of the SNP markers in kilobases; Y-axis represents logarithm of the P-value obtained in the analyses.

