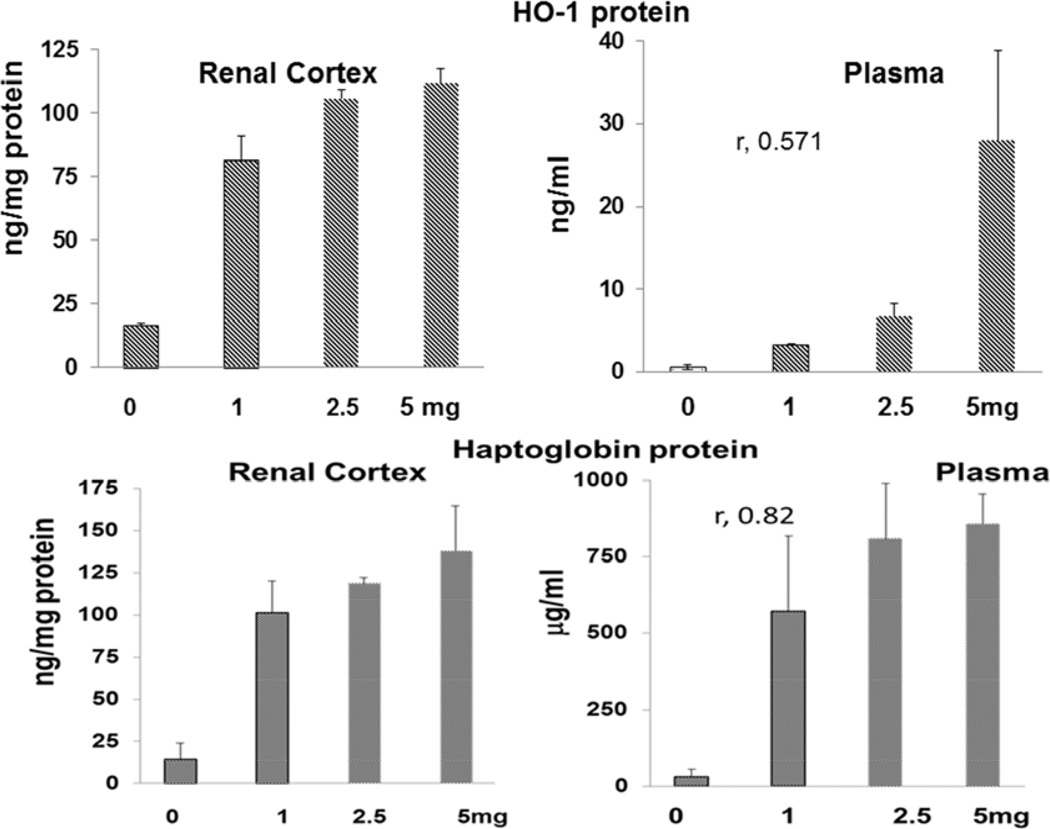
Figure 8. Dose - response relationship between increasing doses of N-Mgb (with a fixed dose of SnPP, 1 umole) and HO-1 / haptoglobin protein levels in renal cortex and plasma.
Increasing doses of N-Mgb, administered IP, led to increasing levels of each protein in plasma and renal cortex. The correlation coefficients for plasma vs. renal concentrations were 0.57 and 0.82 for HO-1 and haptoglobin, respectively. The correlations between the dose administered and plasma protein levels were r, 0.85 and r, 0.75 for HO-1 and haptoglobin, respectively.

