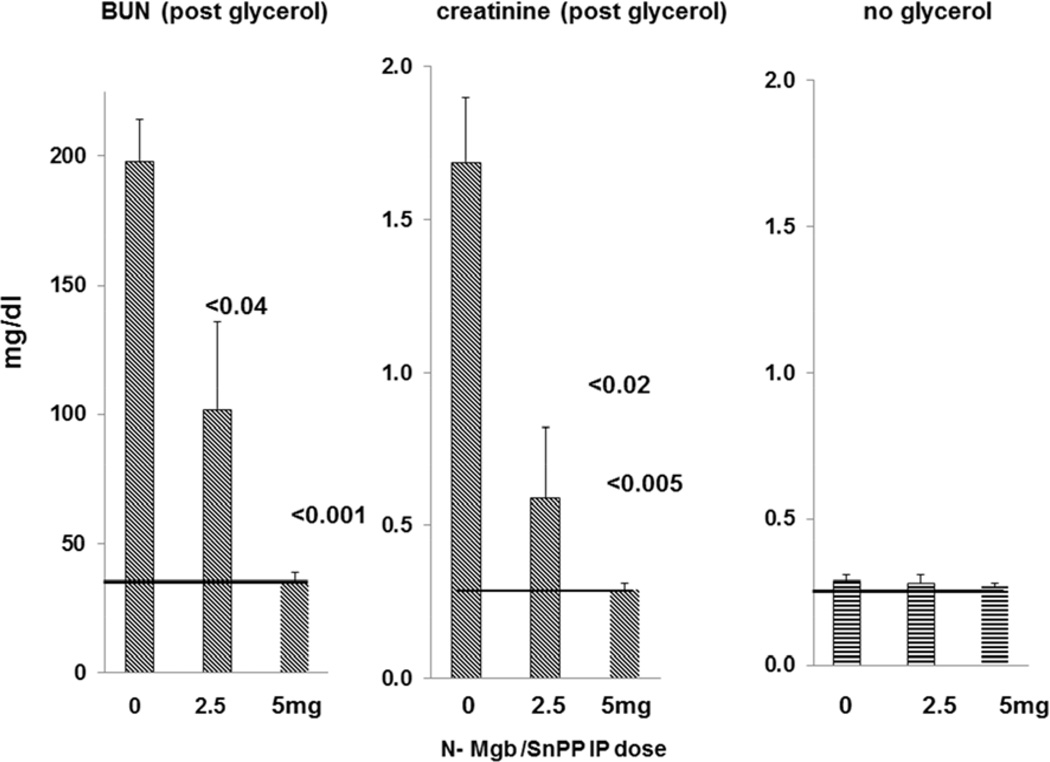
Figure 9. Dose – response relationship between administered IP dose of N-Mgb vs. BUN / creatinine concentrations at 18 hrs post glycerol administration.
Increasing doses of N-Mgb (with a fixed dose of SnPP; 1 µmole) led to increasing degrees of protection against glycerol- induced AKI. When analyzed with the results given in Figure 8, strong direct relationships between plasma and renal cortical HO-1 / haptoglobin concentrations and. degrees of protection against glycerol- induced AKI are apparent. The horizontal lines indicate normal BUN and creatinine concentrations. As shown at the right, the administered doses were well tolerated by the kidney, as evidenced by maintenance of normal 18 hr plasma creatinine concentrations across the tested dosage range.

