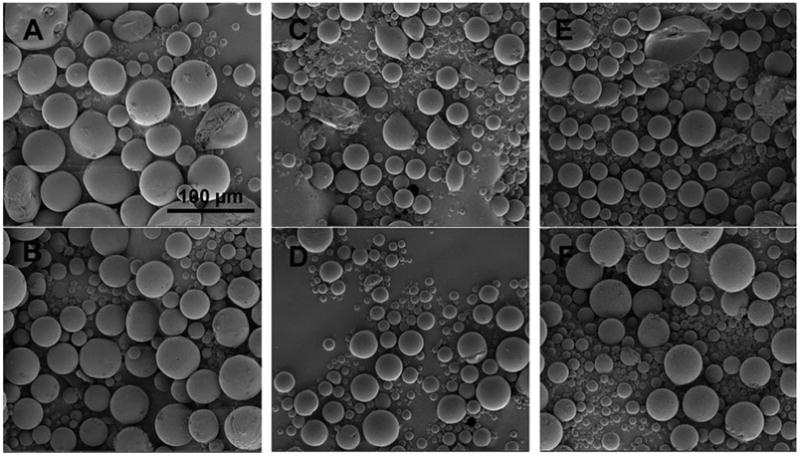
Figure 7.

SEM images of star points of the CCD microspheres. Figures 7-A (top left panel), B (bottom left panel), C (top middle panel), D (bottom middle panel), E (top right panel), and F (bottom right panel) are corresponding to formulations CCD-1, 15, 3, 6, 8 and 17, respectively. Center point parameters were used for these formulations except: 1) the DLG7E ratio was different for CCD-1 (20%) and CCD-15 (100%); 2) the dexamethasone amount was different for CCD-3 (50 mg) and CCD-6 (100 mg); and 3) the total polymer amount was different for CCD-8 (400 mg) and CCD-17 (600 mg).
