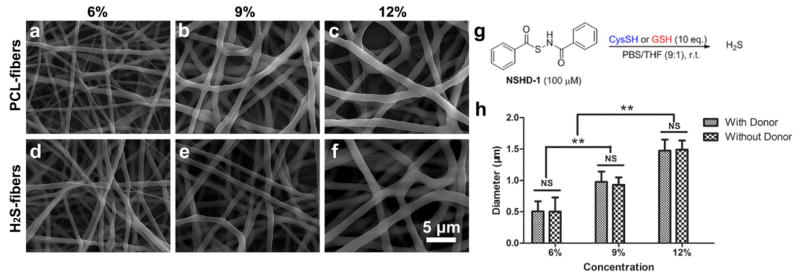
Figure 1.

SEM images of H2S-fibers (a–c) and PCL-fibers (d–f) generated from 6%, 9% and 12% w/v solutions (from left to right). All images share the same scale bar in (f). (g) The H2S donor, NSHD-1, releases H2S in the presence of cysteine o GSH. (h) Fiber diameters plot as a function of solution concentrations. The dopant, NSHD1, has no obvious effect on fiber diameters. All data are expressed as mean ± SE, and statistical significance was assessed using two-way ANOVA. ** indicates P < 0.05; NS indicates not significant (n = 200).
