Figure 5.
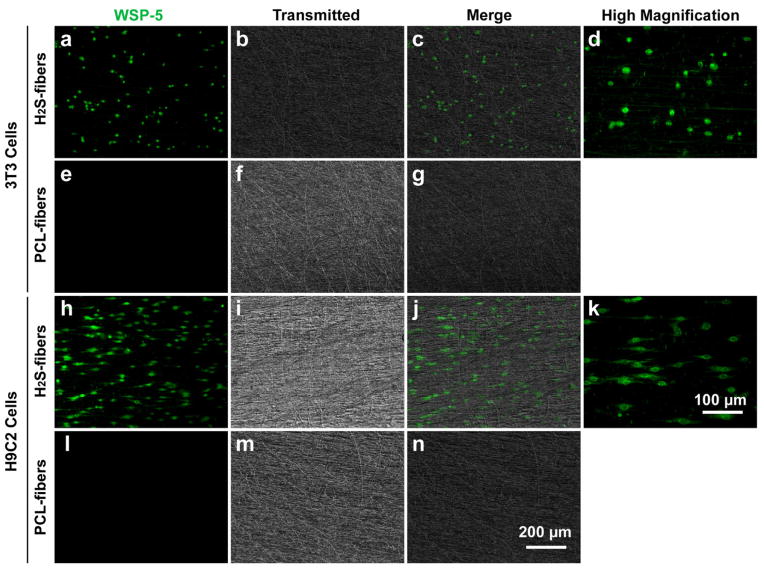
H2S detection in NIH 3T3 cells and H9c2 cells. NIH 3T3 (top 2 rows) and H9c2 cells (bottom two rows) were cultured on H2S-fibers (first and third rows) or PCL-fibers (second and last rows) for 12 hours, 100 μM of a H2S fluorescent probe (WSP-5, green channel) was used to detect H2S production in cells. (d) and (k) are higher magnification view of (a) and (h), respectively. (a–c), (e–g), (h–j), and (l–n) share the scale bar as in (n). (d) and (k) share the scale bar in (k).

