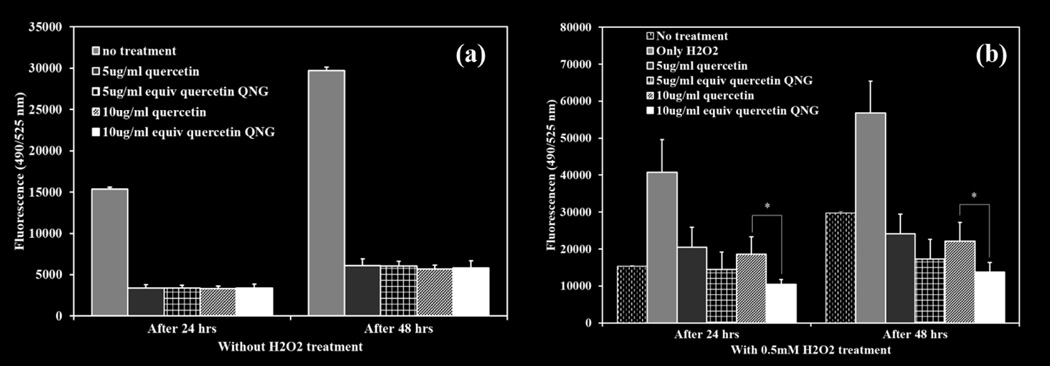
Figure 11.
Oxidative stress suppression analysis using 10 µM DCF-DA as an oxidative stress marker. Two different of QNG/quercetin, 5 and 10 µg/ml were used. Fluorescence was measured after 24 and 48 hours of treatment. (a) Treatment with QNG/quercetin. (b) Treatment with QNG/quercetin and 0.5mM H2O2. * p<0.05, (n=4, M±SD)

