Figure.
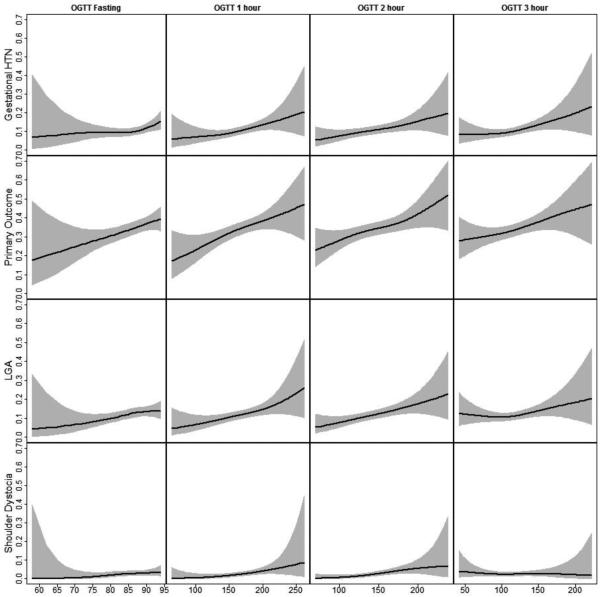
Non-parametric associations between OGTT values and pregnancy outcomes. The black line indicates the predicted probability of an outcome, and the grey region indicates the 95% confidence interval around that predicted probability. We found a statistically significant departure from linearity for fasting glucose and gestational hypertension/preeclampsia (top left), with an increase in the slope of the association for glucose values between 85 and 94 mg/dL (top left). We found linear associations between 3-hour OGTT parameters and gestational hypertension/preeclampsia (1-, 2- and 3-hour ), the primary outcome (all OGTT parameters), LGA (fasting, 1- and 2-hour), and shoulder dystocia (1- and 2-hour).

