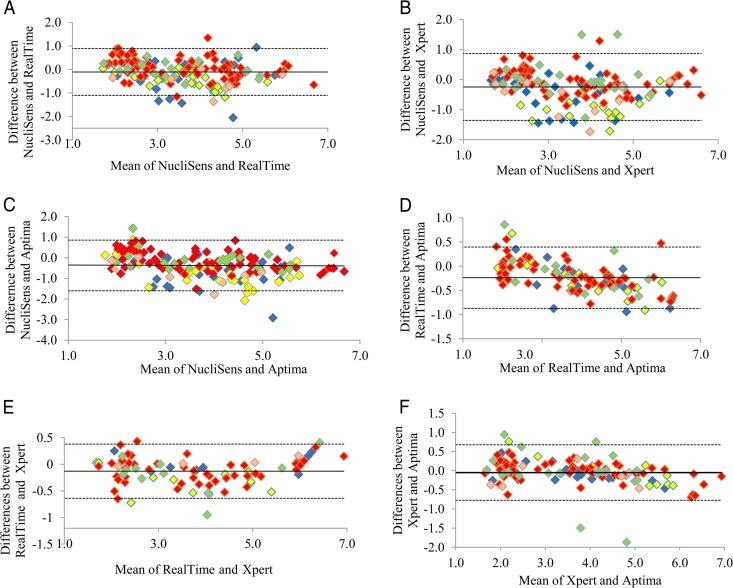
FIG 2.
Bland-Altman plots of data analyzed by the NucliSens v2.0 and RealTime (A), NucliSens v2.0 and Xpert (B), NucliSens v2.0 and Aptima (C), RealTime and Aptima (D), RealTime and Xpert (E), and Xpert and Aptima (F) assays. The x axes show the averages of any two measurements, and the y axes show the percent difference between those two measurements. Horizontal solid lines, mean differences; dashed lines, 95% limits of agreement. Yellow symbols, subtype A1; red symbols, subtype B; green symbols, subtype C; light orange symbols, subtype CRF02_AG/G; blue symbols, subtype not defined.

