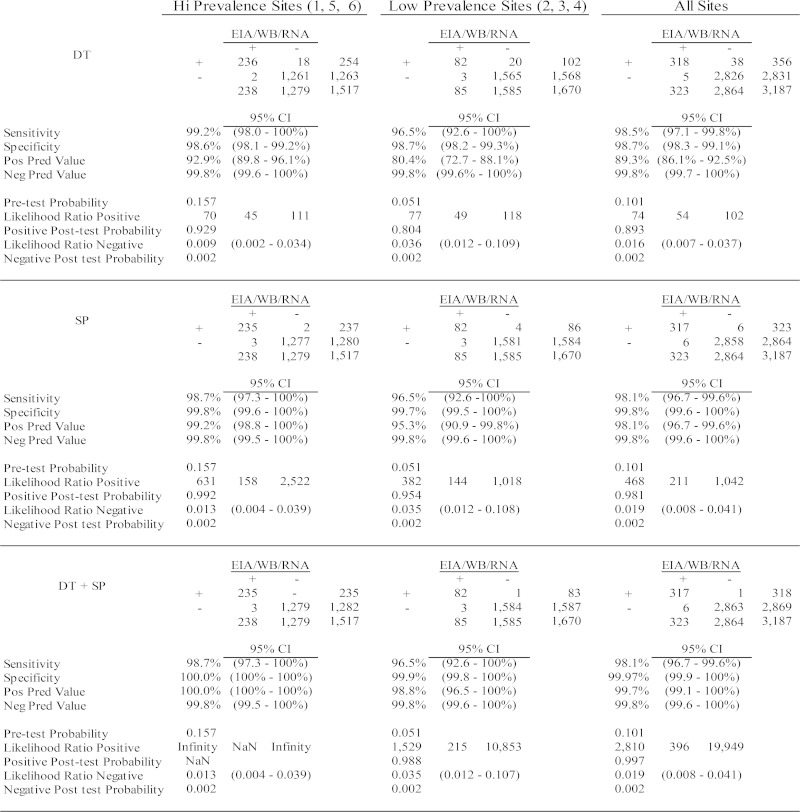
FIG 2.
Results of laboratory tests and RDTs for the higher and lower prevalence sites. Results of DT or SP independently or in combination are compared to those of the reference laboratory algorithm. Calculations of sensitivity, specificity, positive likelihood ratio, and negative likelihood ratio of each test or in combination for correct classification of HIV infection are shown.

