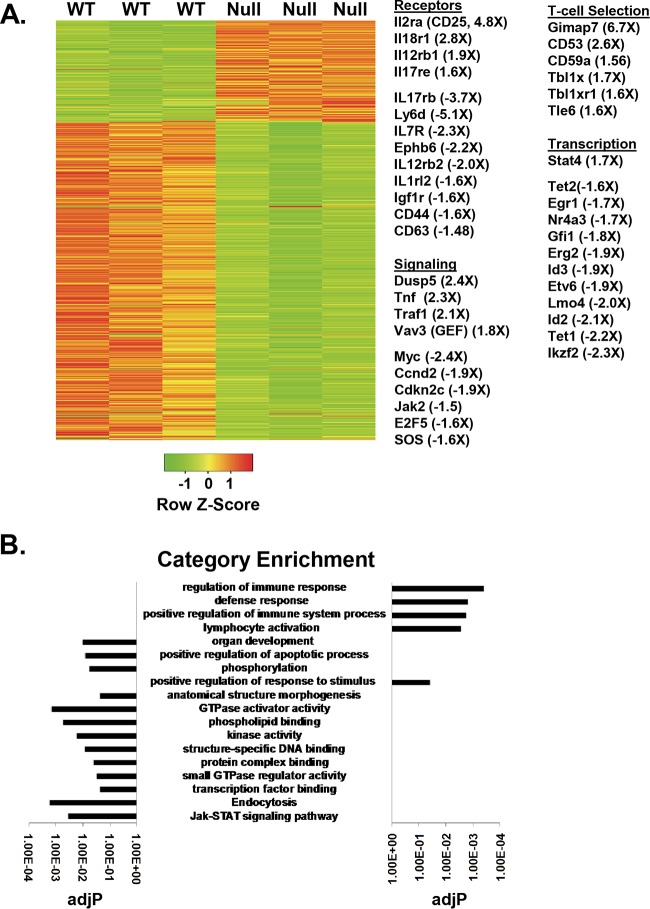
FIG 3.
Gene expression analysis of WT and Hdac3−/− (Null) CD4/CD8-positive thymocytes. (A) Heat map showing the log2 values of the relative fluorescence intensity of 1,800 genes affected by the loss of Hdac3. (Right) Gene ontology groupings of genes and the fold change in gene expression. (B) Bar graph showing the pathways affected by the inactivation of Hdac3. P values were calculated using a hypergeometric test (raw P value) and adjusted by multiple testing (adjusted P values [adjP]).

