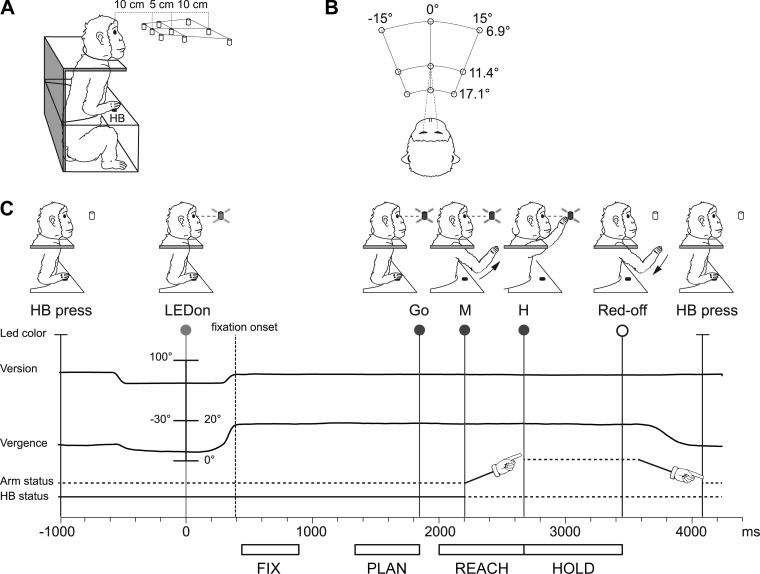
Fig. 2.
Experimental setup and task sequence. A: scheme of the setup used for the task. Nine light-emitting diodes (LEDs) that were used as fixation and reaching targets were located at eye level. The distances of the 3 targets of the central row from mid-eye level are shown. HB, home button. B: top view of the target configuration showing the values of version and vergence angles. C: time sequence of task events with LED status, the eye's vergence and version traces, arm status, and HB status. From left to right, vertical lines indicate, respectively, trial start (HB press), target appearance (LEDon), fixation onset (dashed line, end of saccade movement), go signal (Go), start of the arm movement (M), holding phase of the target (H), turning off of the LED (Red-off), and trial end (HB press). Arm drawings indicate the forward and backward arm movement. White bars below the time axis illustrate the time intervals (epochs) used for the analysis of neural activity, from left to right: Fix, from 50 ms after fixation onset till 450 ms after it; Plan, the last 500 ms before the Go signal; Reach, from 200 ms before the start of the arm movement (M) to the pressing of the LED; Hold, from LED pressing till Red-off.

