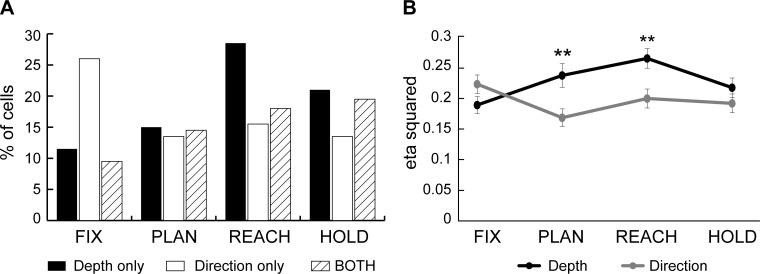
Fig. 4.
Depth, direction, and combined tuning during each task epoch. A: percentage of cells in the population of PEc (n = 200) with tuning for depth only (solid), direction only (open), and both signals (hatched) during different task epochs (Fix, Plan, Reach, and Hold). B: strength of depth and directional tuning. Depth (black) and direction (gray) effect size calculated as mean ± SE of the eta-squared (η2) index for the population of neurons modulated in each epoch. Tuning strength for depth increased after the fixation epoch and reached a maximum at the movement epoch. Direction effect remained was highest in Fix and decreased to relatively constant levels in the subsequent epochs. Asterisks indicate a significant (Student's t-test, P < 0.01) difference between the depth and direction effects.

