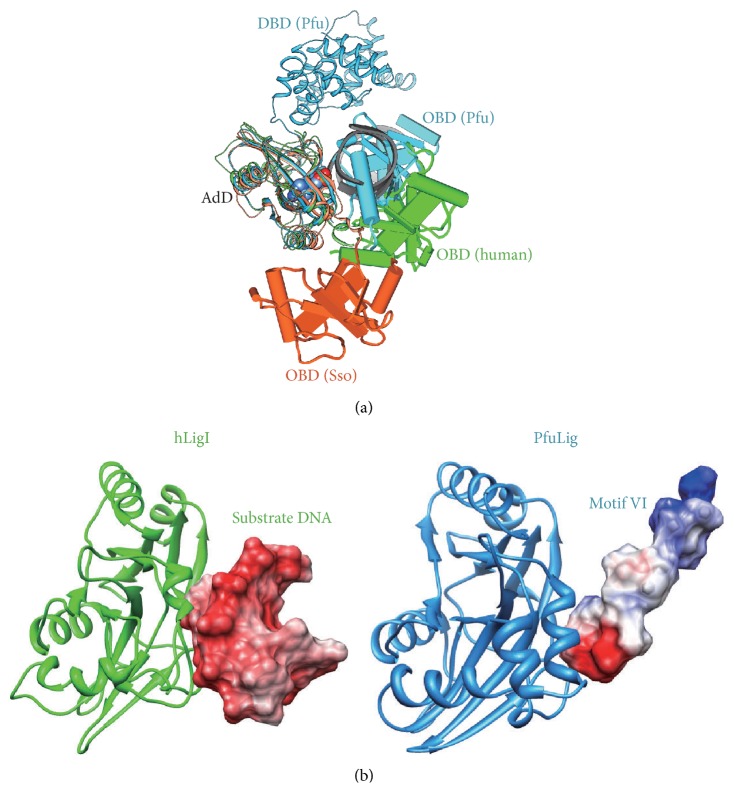
Figure 10.
Superimposed ribbon diagrams. (a) Ribbon diagrams of PfuLig (2CFM, blue), hLigI (1X9N, green), and SsoLig (2HIV, orange), in which the AdD from each ligase were maximally overlapped with each other. The DBD from hLigI and SsoLig were omitted, for clarity. The arrangements of the OBD relative to the AdD in each ligase are apparently different from each other. Notably, the OBD from PfuLig is closely bound to AdD and is replaced by the bound-DNA substrate (grey) in hLigI. (b) Superimposed diagrams of adenylation domains from PfuLig and hLigI, flanked by surface representations of motif VI (PfuLig) and the upstream region of the substrate DNA (hLigI), in which the electrostatic distributions (positive charge, blue; negative charge, red) are mapped onto the molecular surfaces. Since the electrostatic distributions on the surfaces nearby the AdD of motif VI and the DNA are both negatively charged, the replacement of motif VI with DNA may easily occur.

