
Figure 3.
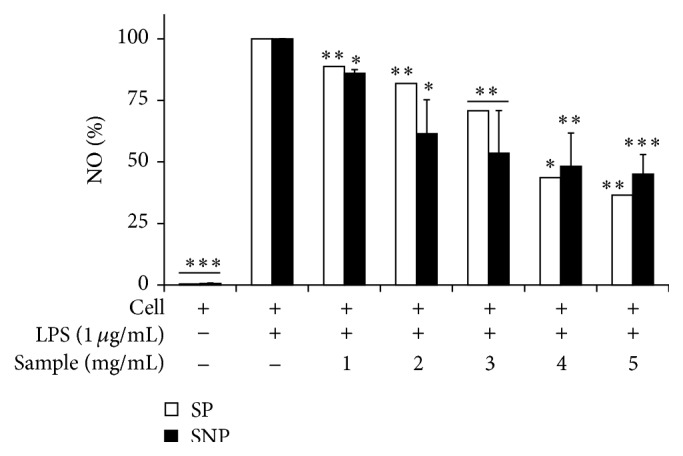
Inhibitory effect of PFSP extracts (SP (Steamed, Peeled) and SNP (Steamed, No Peeled)) on NO production in a culture medium of LPS-induced RAW 264.7 cells. Each value is expressed as mean ± SD (n = 3). ∗ indicates P < 0.05, ∗∗ indicates P < 0.01, and ∗∗∗ indicates P < 0.001 versus cells with LPS (negative control).