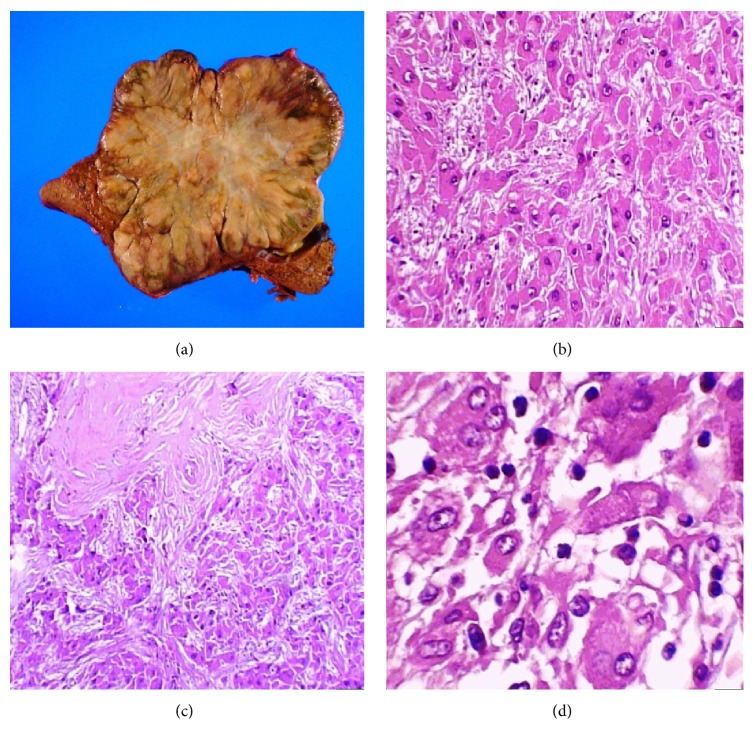
Figure 3.
(a) Macroscopic image of the liver that shows a 9 × 7 cm, central yellowish lesion with diffuse, infiltrating borders with a whitish central lesion. (b) shows neoplastic cells separated into nodules by connective tissue (H and E stain, 50x). (c) Neoplastic cells with loss of the nucleus-cytoplasm relationship (H and E stain, 100x). (d) Image that shows the cellular and nuclear pleomorphism in greater detail (H and E stain, 400x).

