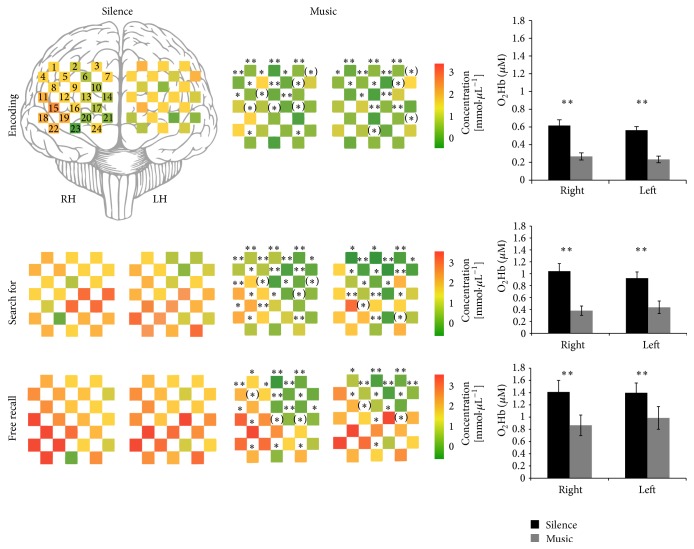
Figure 4.
O2Hb Δ-to baseline values expressed in micromoles for silence (left side) and music (right side) conditions, for all 48 channels (24 right -RH-, 24 left -LH-), during the encoding, “search for” and free recall phases. Red = more activated; green = less activated. The whole prefrontal cortex resulted significantly less activated in the music condition during the three phases. ∗∗, ∗, and (∗) on the music channels show statistically significant differences (resp., P < .01, P < .05, and .05 < P < .09) between the two conditions for each channel. The difference between the two conditions is also showed in the left right of the figure, with black and grey bars representing O2Hb Δ-to baseline mean values, respectively, for silence and music conditions, in the right and left hemisphere (∗∗ for P < .01 resulted from paired t-tests comparisons).

