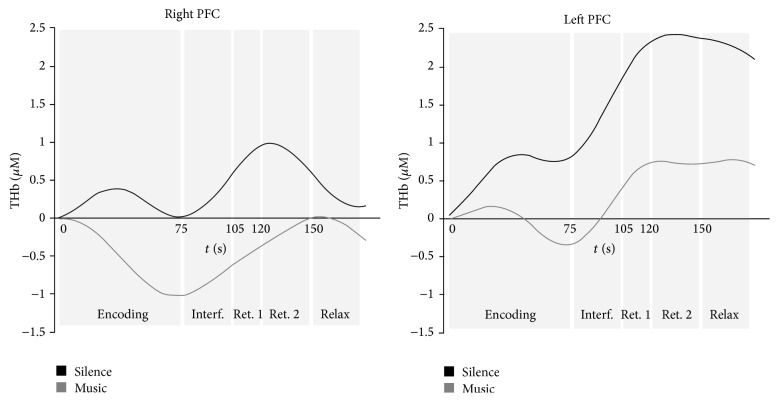
Figure 5.
Representative single-subject time-series analysis showing THb values expressed in micromoles for silence (black lines) and music (grey lines) conditions, in right (left side) and left (right side) PFC during the encoding, interference, “search for” (ret. 1), free recall (ret. 2), and relax phases.

