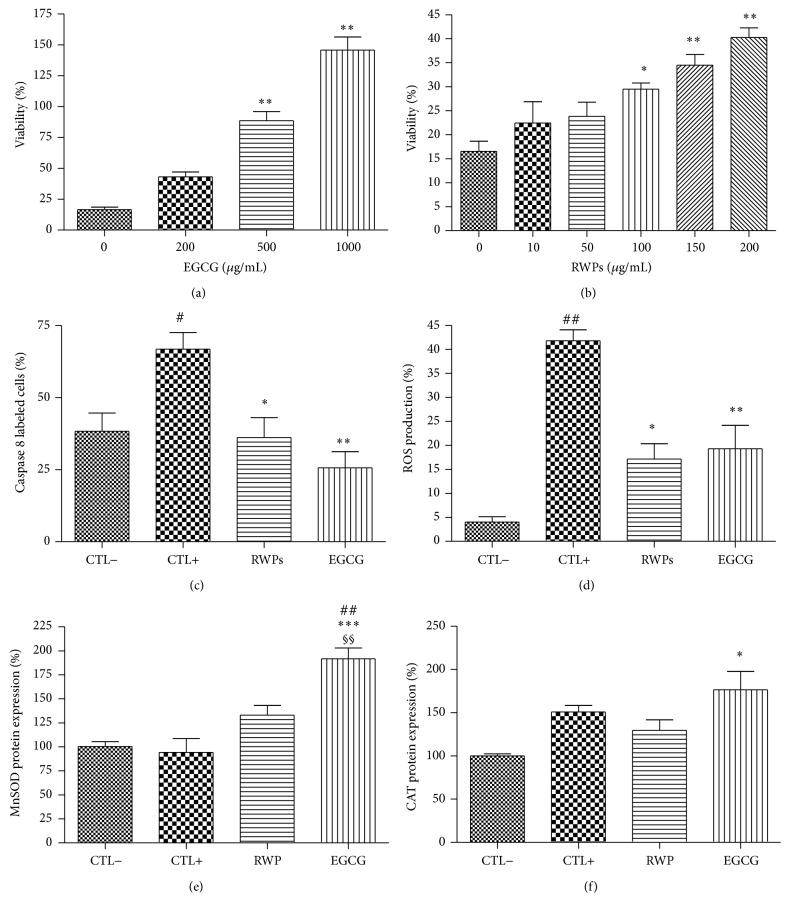
Figure 4.
Effects of the antioxidants RWPs and EGCG on cell viability (a, b), caspase 8 activity/apoptosis (c), ROS production (d), MnSOD expression (e), and CAT expression (f) during HX/XO-induced oxidative stress. Values are given as the mean ± SEM for three different experiments. n = 6; ∗ P < 0.05, ∗∗ P < 0.01, and ∗∗∗ P < 0.001 compared to the unstressed control cells (CTL−); # P < 0.05, ## P < 0.01 compared to the stressed control cells (CTL+); §§ P < 0.01 compared to the stressed cells treated with RWPs.

