Figure 1.

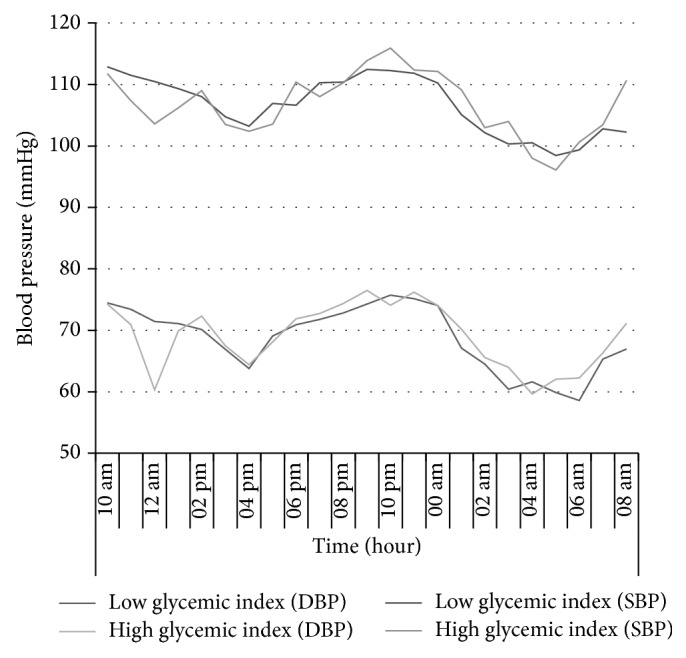
Constant SBP and DBP measurements in HGI and LGI groups at baseline and after the 24-hour interventions (values are expressed as mean ± SEM).

Constant SBP and DBP measurements in HGI and LGI groups at baseline and after the 24-hour interventions (values are expressed as mean ± SEM).