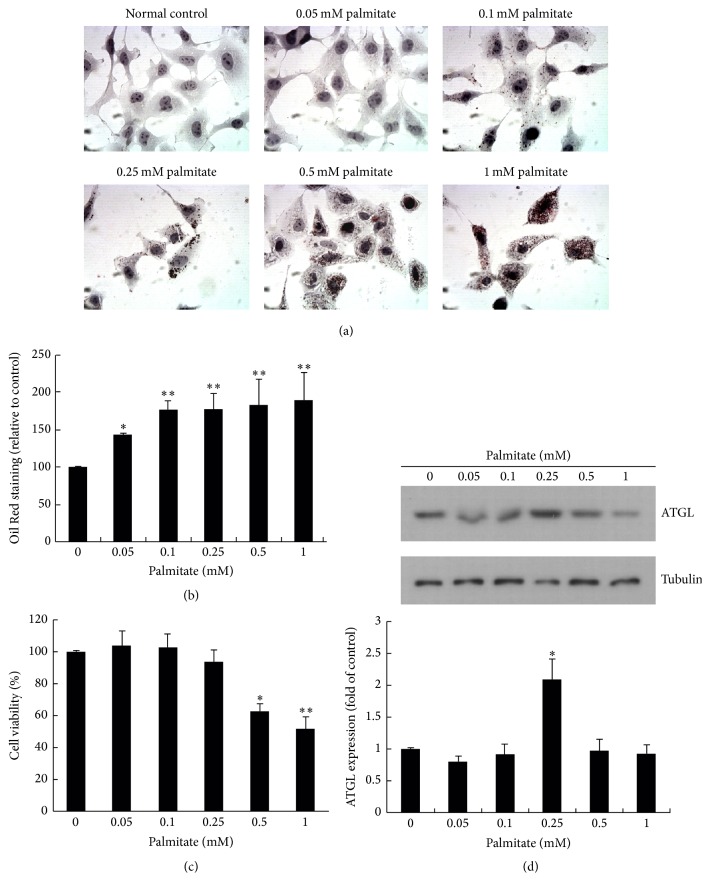
Figure 2.
The fatty liver cell model—a high fat environment increases intracellular lipid formation in HuS-E/2 cells and induces ATGL expression. (a) Micrographs of HuS-E/2 cells incubated for 24 h in glucose-free PH medium with different concentrations of palmitate to simulate a high fat environment. Cells were stained with Oil Red O and observed under a microscope at 400x original magnification. (b) Quantitative analysis of lipid deposition in cells using Oil Red O staining. HuS-E/2 cells were treated with the indicated concentration of palmitate in glucose-free PH medium for 24 h. The data represent the mean ± SD for three independent experiments and are expressed as a percentage of the control value. (c) Cell viability in the high fat environment. HuS-E/2 cells were incubated with the indicated concentration of palmitate in glucose-free PH medium for 24 h as above; then, cell viability was determined using the MTT assay. The data represent the mean ± SD for three independent experiments and are expressed as a percentage of the control value. (d) Western blots showing ATGL and tubulin levels in HuS-E/2 cells incubated with the indicated concentration of palmitate in glucose-free PH medium for 24 h. The upper panel shows a representative result of those obtained in three experiments and the lower panel shows the quantitative analysis of ATGL expression normalized to that of tubulin and expressed as a fold value relative to the control value. The data represent the mean ± SD for three independent experiments. ∗ p < 0.05 and ∗∗ p < 0.01 versus control.

