
FIGURE 4.
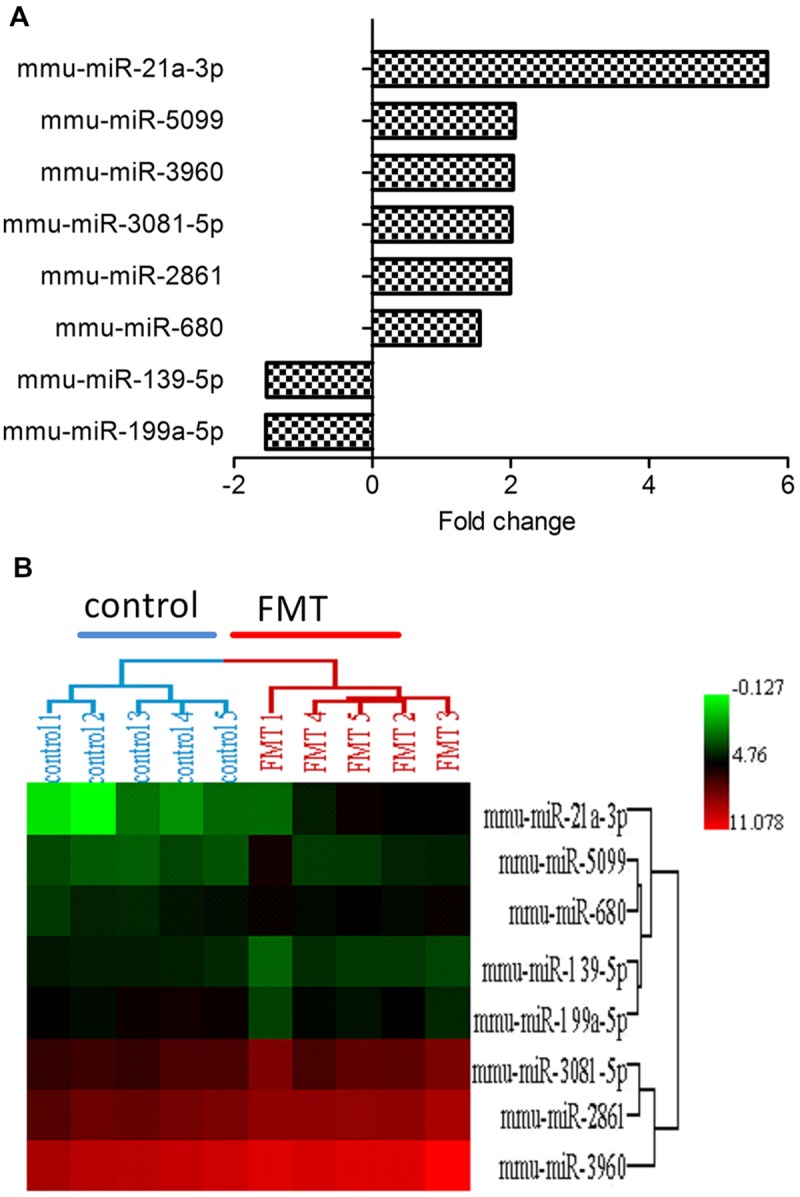
(A) The differentially expressed miRNAs in FMT water extract group. There were eight miRNAs (0.64%) of total 1,247 studied miRNAs differentially expressed in FMT water extract group when compared with control group (n = 5). six miRNAs were upregulated (fold change > 1.5) and 2 miRNAs were downregulated (fold change < -1.5); (B) Hierarchical Cluster Analysis (HCA) within ArrayTrack® was used to visualize clusters of samples corresponding to the differentially expressed miRNAs. There were two main branches detected (FMT water extract-treated mice versus control mice).