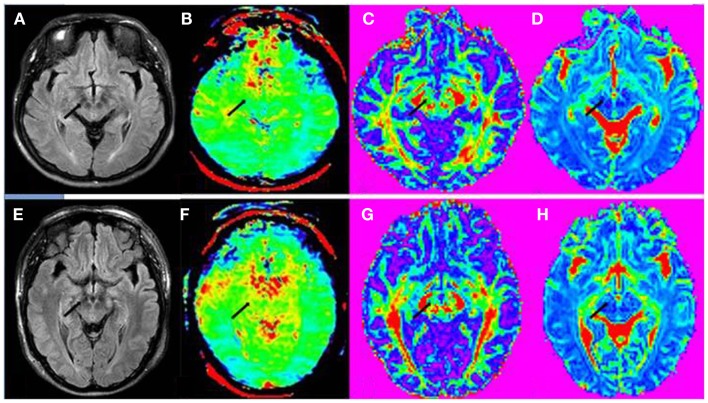
Figure 3.
(A) FLAIR image, (B) APT-weighted image, (C) FA image, and (D) MD image of a PD patient (female; 53 years old; H&Y stage 3). (E) FLAIR image, (F) APT-weighted image, (G) FA image, and (H) MD image of a normal control (male; 65 years old). The CEST/APT imaging acquisition protocol provided B0 inhomogeneity-corrected, APT-weighted images with sufficient signal-to-noise ratios. The APT-weighted intensities in regions of the substantia nigra (black arrow) were lower in PD patient than in normal control. The FA values in regions of the substantia nigra (black arrow) seemed to be similar for this PD patient and normal control though they have group differences. The MD value in regions of the substantia nigra (black arrow) also seemed to be similar for this PD patient and normal control.

