Figure 1.
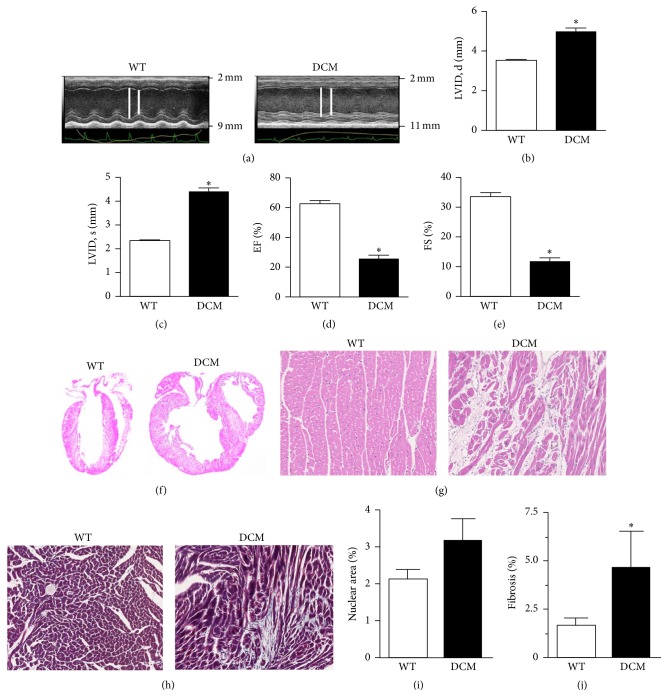
DCM hearts display contractile dysfunction, fibrosis, and myocardial disarray. (a) Representative parasternal long-axis M-mode echocardiographic images of WT and DCM hearts. Left ventricular internal diameter (LVID) is depicted by white lines (note: difference in scale between images). LVID at (b) peak diastole and (c) peak systole in WT and DCM hearts (n = 9 hearts, ∗ P < 0.001). Functional measurements derived from LVID measurements showing (d) ejection fraction (EF) and (e) fractional shortening (FS) in WT and DCM hearts (n = 9 hearts, ∗ P < 0.001). (f) H&E labeled whole hearts from WT and DCM animals. (g) H&E or (h) Masson's trichrome-labeled regions of interest (ROI) from WT and DCM hearts. (i) Quantification of cellularity based on nuclear area between WT (n = 5 hearts, 5 sections per heart) and DCM hearts (n = 4 hearts, 5 sections per heart). (j) Quantification of fibrosis (trichrome staining) area between WT (n = 4 hearts, 20 sections per heart) and DCM hearts (n = 4 hearts, 20 sections per heart; ∗ P < 0.0225). Data are represented as mean ± SEM. Significant differences (P < 0.05) between mean values were determined using Student's t-test.

