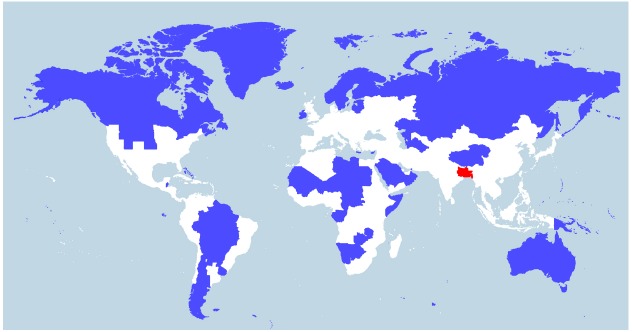
FIGURE 2.

World population density. World map showing two different areas (blue and red) that each house 5% of the world population (394 million). Whereas the blue region encompasses several countries, the red region includes just one country—Bangladesh—and three eastern Indian states (Bihar, Jharkhand, and West Bengal) located in or near the Ganges Delta. The white region represents 90% of the world population. The map was constructed by Max Galka using the QGIS mapping tool with population data taken from the 2014 Credit Suisse Global Wealth Databook, used with permission (Galka, 2015).
