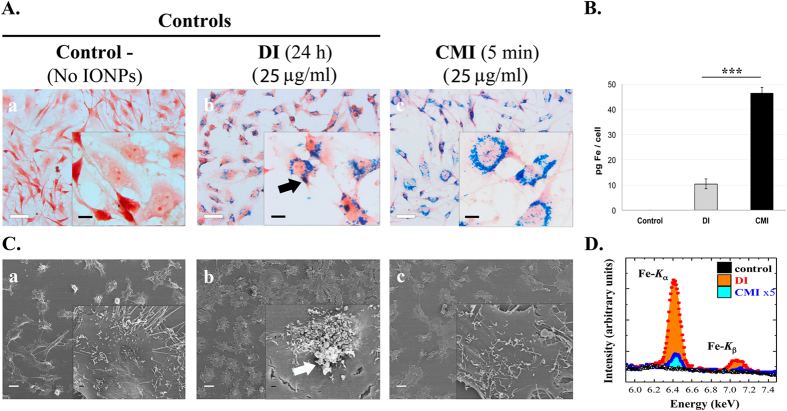
Figure 2. Increased efficacy and efficiency of IONPs internalization into living cells by CMI.
(A) Representative Optical Microscopy images of Prussian blue staining of control cells without IONPs (left panel); cells incubated for 24 hours with IONPs at 25 μg Fe/ml by the DI method (central panel); and cells incubated for 5 minutes with IONPs at 25 μg Fe/ml and internalized by CMI method at 1500 rpm (right panel). DI produces IONPs aggregation on the cell surface (see the black arrow in the central inset). Scale bar: 40 μm in the main images and 10 μm in the insets. (B) Inductively-Coupled Plasma Optical Emission Spectroscopy (ICP-OES) quantification of intracellular iron content of cells incubated with IONPs at 25 μg Fe/ml internalized by DI and CMI methods. C) Representative Scanning Electron Microscopy (SEM) images of cells incubated with IONPs at 25 μg Fe/ml by DI and CMI methods. Control cells without IONPs (left panel), cells with IONPs incubated by DI for 24 hours (central panel) and cells with IONPs internalized by CMI at 1500 rpm for 5 minutes (right panel). The white arrow shows the accumulation of IONPs on the cell surface in the DI case. (E) Representative Energy Dispersive X-Ray (EDX) spectra analysis reflecting the presence of iron on the extracellular membrane of U251 cells after IONP internalization by DI and CMI methods. Notice the different scales for DI and CMI methods.

