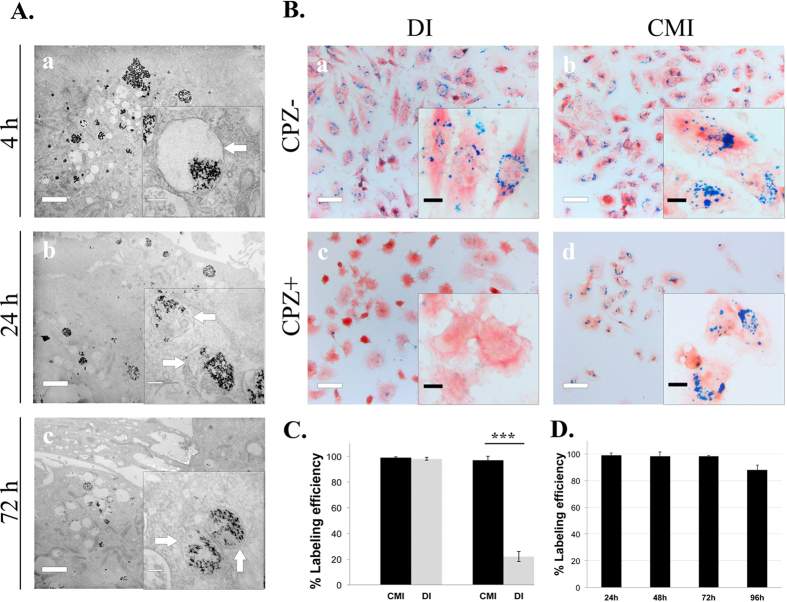
Figure 3. Endocytosis-independent internalization of IONPs into living cells by the CMI method.
(A) Transmission Electron Microscopy (TEM) images of the time evolution of IONPs internalized by CMI into U251 cells. Scale bar 100 nm in the main images and 20 nm in the insets. (B) Endocytosis inhibition by chlorpromazine (CPZ). Prussian blue staining of cells with IONPs (50 μg/ml) internalized by DI (24 hours) or CMI (at 1500 rpm for 5 minutes) in the presence or absence of the clathrin-inhibitor by chlorpromazine (CPZ) (10 μg/ml) for 5 hours. Data are representative of 3 separated experiments. The blue stain density reflects the level of IONPs accumulation within cells. Scale bar: 40 μm in the main images and 10 μm in the insets; (C) Labelling efficiency for both methods (as given by the percentage of Prussian blue positive cells) without and with the clathrin-inhibitor CPZ; (D) Labelling efficiency of IONPs as a function of time after internalization. Note that even after 96 hours the efficiency is larger than 80%. Error bars represent the standard deviation. ***P < 0.001.

