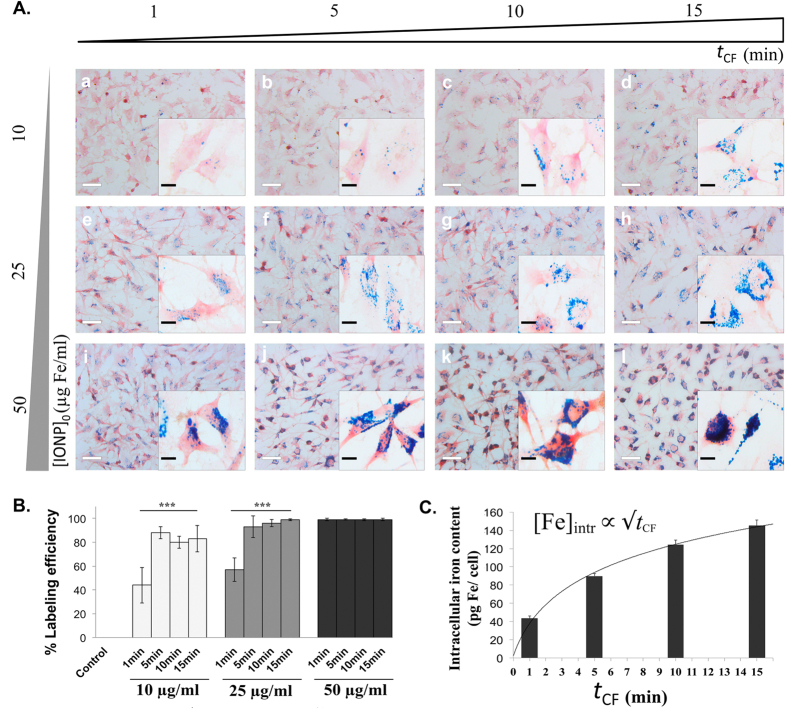
Figure 4. The extent of the IONPs internalization by CMI is proportional to the initial IONPs concentration and the centrifugation time.
(A) Optical microscopy images of U251 cells after Prussian blue staining following IONPs internalization by CMI at 1000 rpm and different IONPs concentrations (10, 25 and 50 μg/ml) and Centrifugal Force application times (1, 5, 10 and 15 minutes). Scale bar: 40 μm and 10 μm; (B) Labeling efficiency of U251 with IONPs internalized by CMI in all different sceneries. (C) Intracellular iron content per U251 cell measured by ICP as a function of centrifugation time for an initial Fe concentration of 50 μg/ml. Error bars represent the standard deviation ***P < 0.001.

