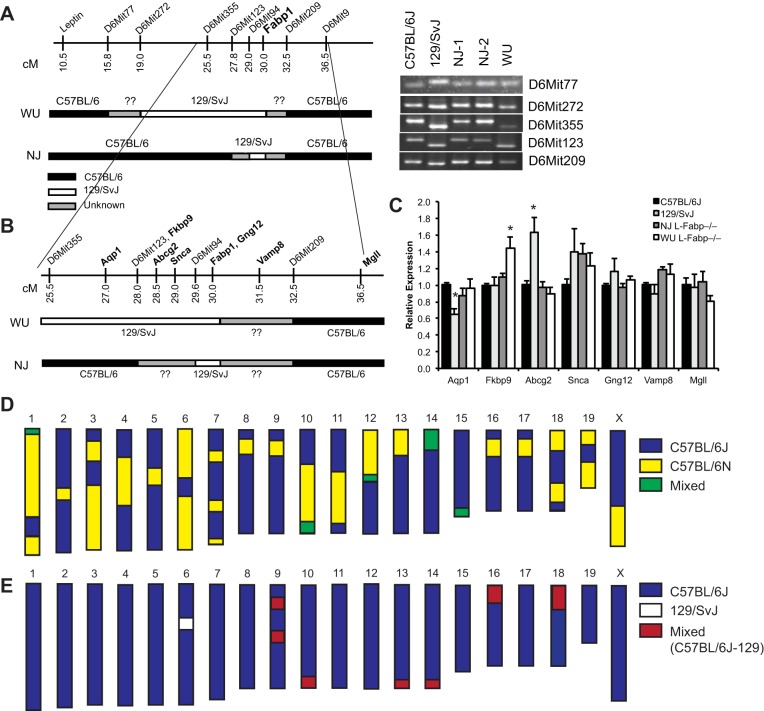
Fig. 8.
Differences in C57BL/6 substrain may contribute to phenotypic differences between NJ and WU L-Fabp−/− mice. A: schematic diagram of simple sequence length polymorphism (SSLP) markers near Fabp1 locus, with genetic background of WU and NJ L-Fabp−/− mice, as determined by SSLP mapping. Regions found to be C57BL/6 are black, regions of 129/SvJ gDNA are white, and undetermined areas are gray. Note that SSLP primers do not distinguish between C57BL/6 substrains. PCR products from several informative markers are shown at right, with C57BL/6J and 129/SvJ gDNA used as controls. A list of additional markers and mapping results is provided in Table 7. B: expanded diagram showing the location of several genes near Fabp1 locus, with genetic background of the respective L-Fabp−/− genotypes shown below. C: relative expression of genes near Fabp1 in the livers of SF diet-fed C57BL/6J, 129/SvJ (26), and NJ and WU L-Fabp−/− mice. Values are means ± SE; n = 3–5 samples per genotype. D and E: schematic diagrams depicting results of C57BL/6 substrain single-nucleotide polymorphism (SNP) panel in NJ (D) and WU (E) L-Fabp−/− mice. For D, chromosomal regions identified as C57BL/6J are blue, regions identified as C57BL/6N are yellow, and regions that are variable (animal to animal or heterozygous) are green. For E, C57BL/6J regions are blue, non-C57BL/6J regions (129/SvJ) are white, and mixed regions are red. Actual SNP mapping data are provided in Supplemental Table S1.

