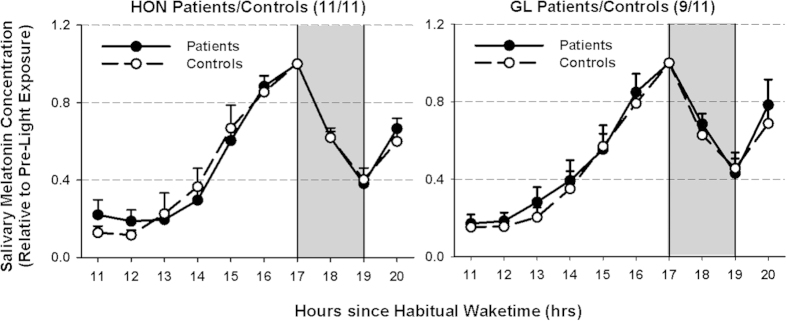
Figure 1. Relative salivary melatonin concentrations for HON patients (left side) and GL patients (right side) and their controls before, during and after 2 hours of light exposure (LE) at night.
Values are expressed relative to pre-light exposure melatonin concentrations. In response to light exposure (starting after 17 hours after habitual wake time), salivary melatonin was similarly suppressed in both patient groups (HON and GL) when compared to their controls (p > 0.6). Filled circles and solid lines = patients; open circles and dashed lines = controls. N = 11 in each group except for GL patients (N = 9; mean + SEM; grey areas indicate the light exposure).

