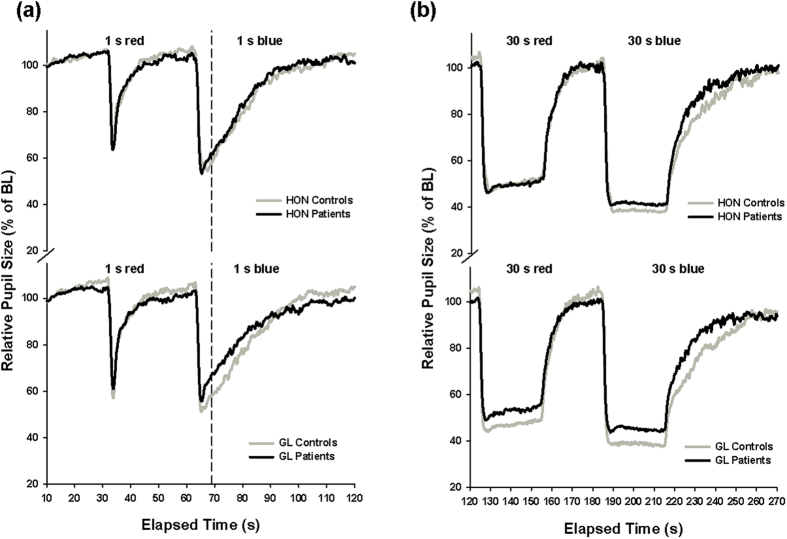
Figure 3.
(a,b) Averaged (from three recordings) pupil tracings for the 1 s (a) and 30 s (b) red and blue light stimuli for HON patients (upper graphs) and GL patients (lower graphs) and their controls (black lines = patients; N = 11/11; grey lines = controls; N = 11/11). The vertical dashed line indicates the approximate pupil size 6s after light termination (=PSPS). Significant differences were observed between GL patients and controls but not between HON patients and controls except for the minimum pupil size (MPS) during 30 s (p < 0.05). For more results, see Table 2.

