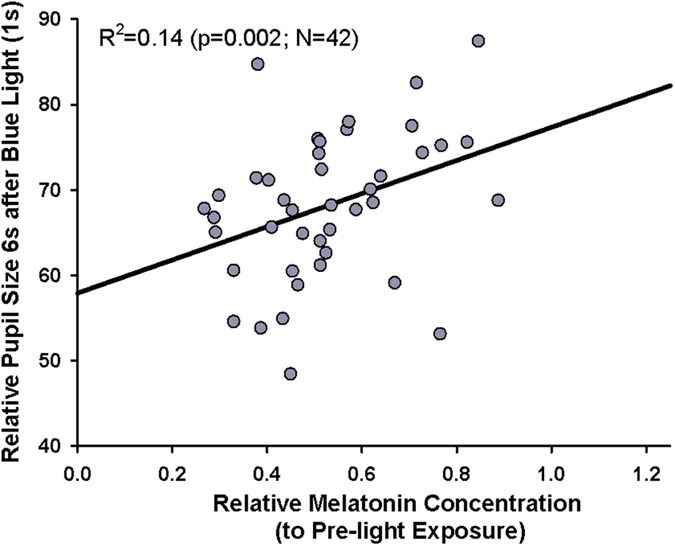
Figure 4. Spearman Correlation between post-stimulus pupil size in response to 1 s blue light (relative to baseline) and mean salivary melatonin concentration (relative to pre-light exposure).

Smaller melatonin concentrations indicate greater melatonin suppression; N = 42 (grey circles). The black line shows the regression line (Correlation R2 = 0.14; p = 0.002).
