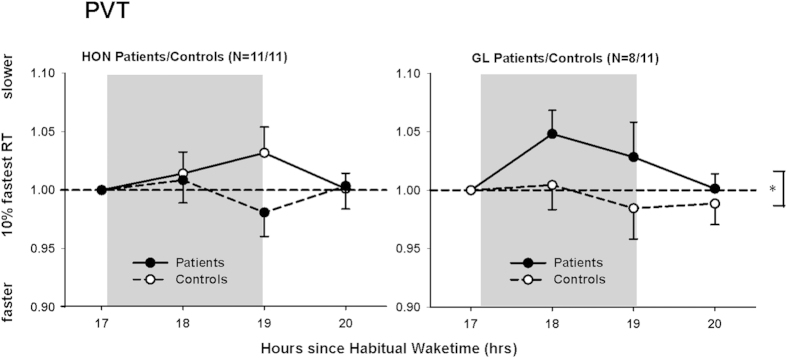
Figure 6. Changes in the 10% fastest reaction times (ms) in the Psychomotor Vigilance Test (PVT) during and after light exposure for HON patients (left side) and GL patients (right side) and their controls.
The 10% fastest reaction times (ms) were similar for HON patients and controls (relative to pre-light exposure), but GL patients were significantly slower than their controls in response to bright LE (N = 11 in each group except for GL patients: N = 8; filled circles = patients; open circles = controls; *<0.05). Grey bars indicate constant bright light exposure (means + or – SEM).

